Overview
SpatialX is an integrated platform for multi-image, multi-technology spatial data (CosMx, Xenium, Visium). It provides algorithms and tools for in-context analysis, optimized computation, and an updated cell-annotation database.
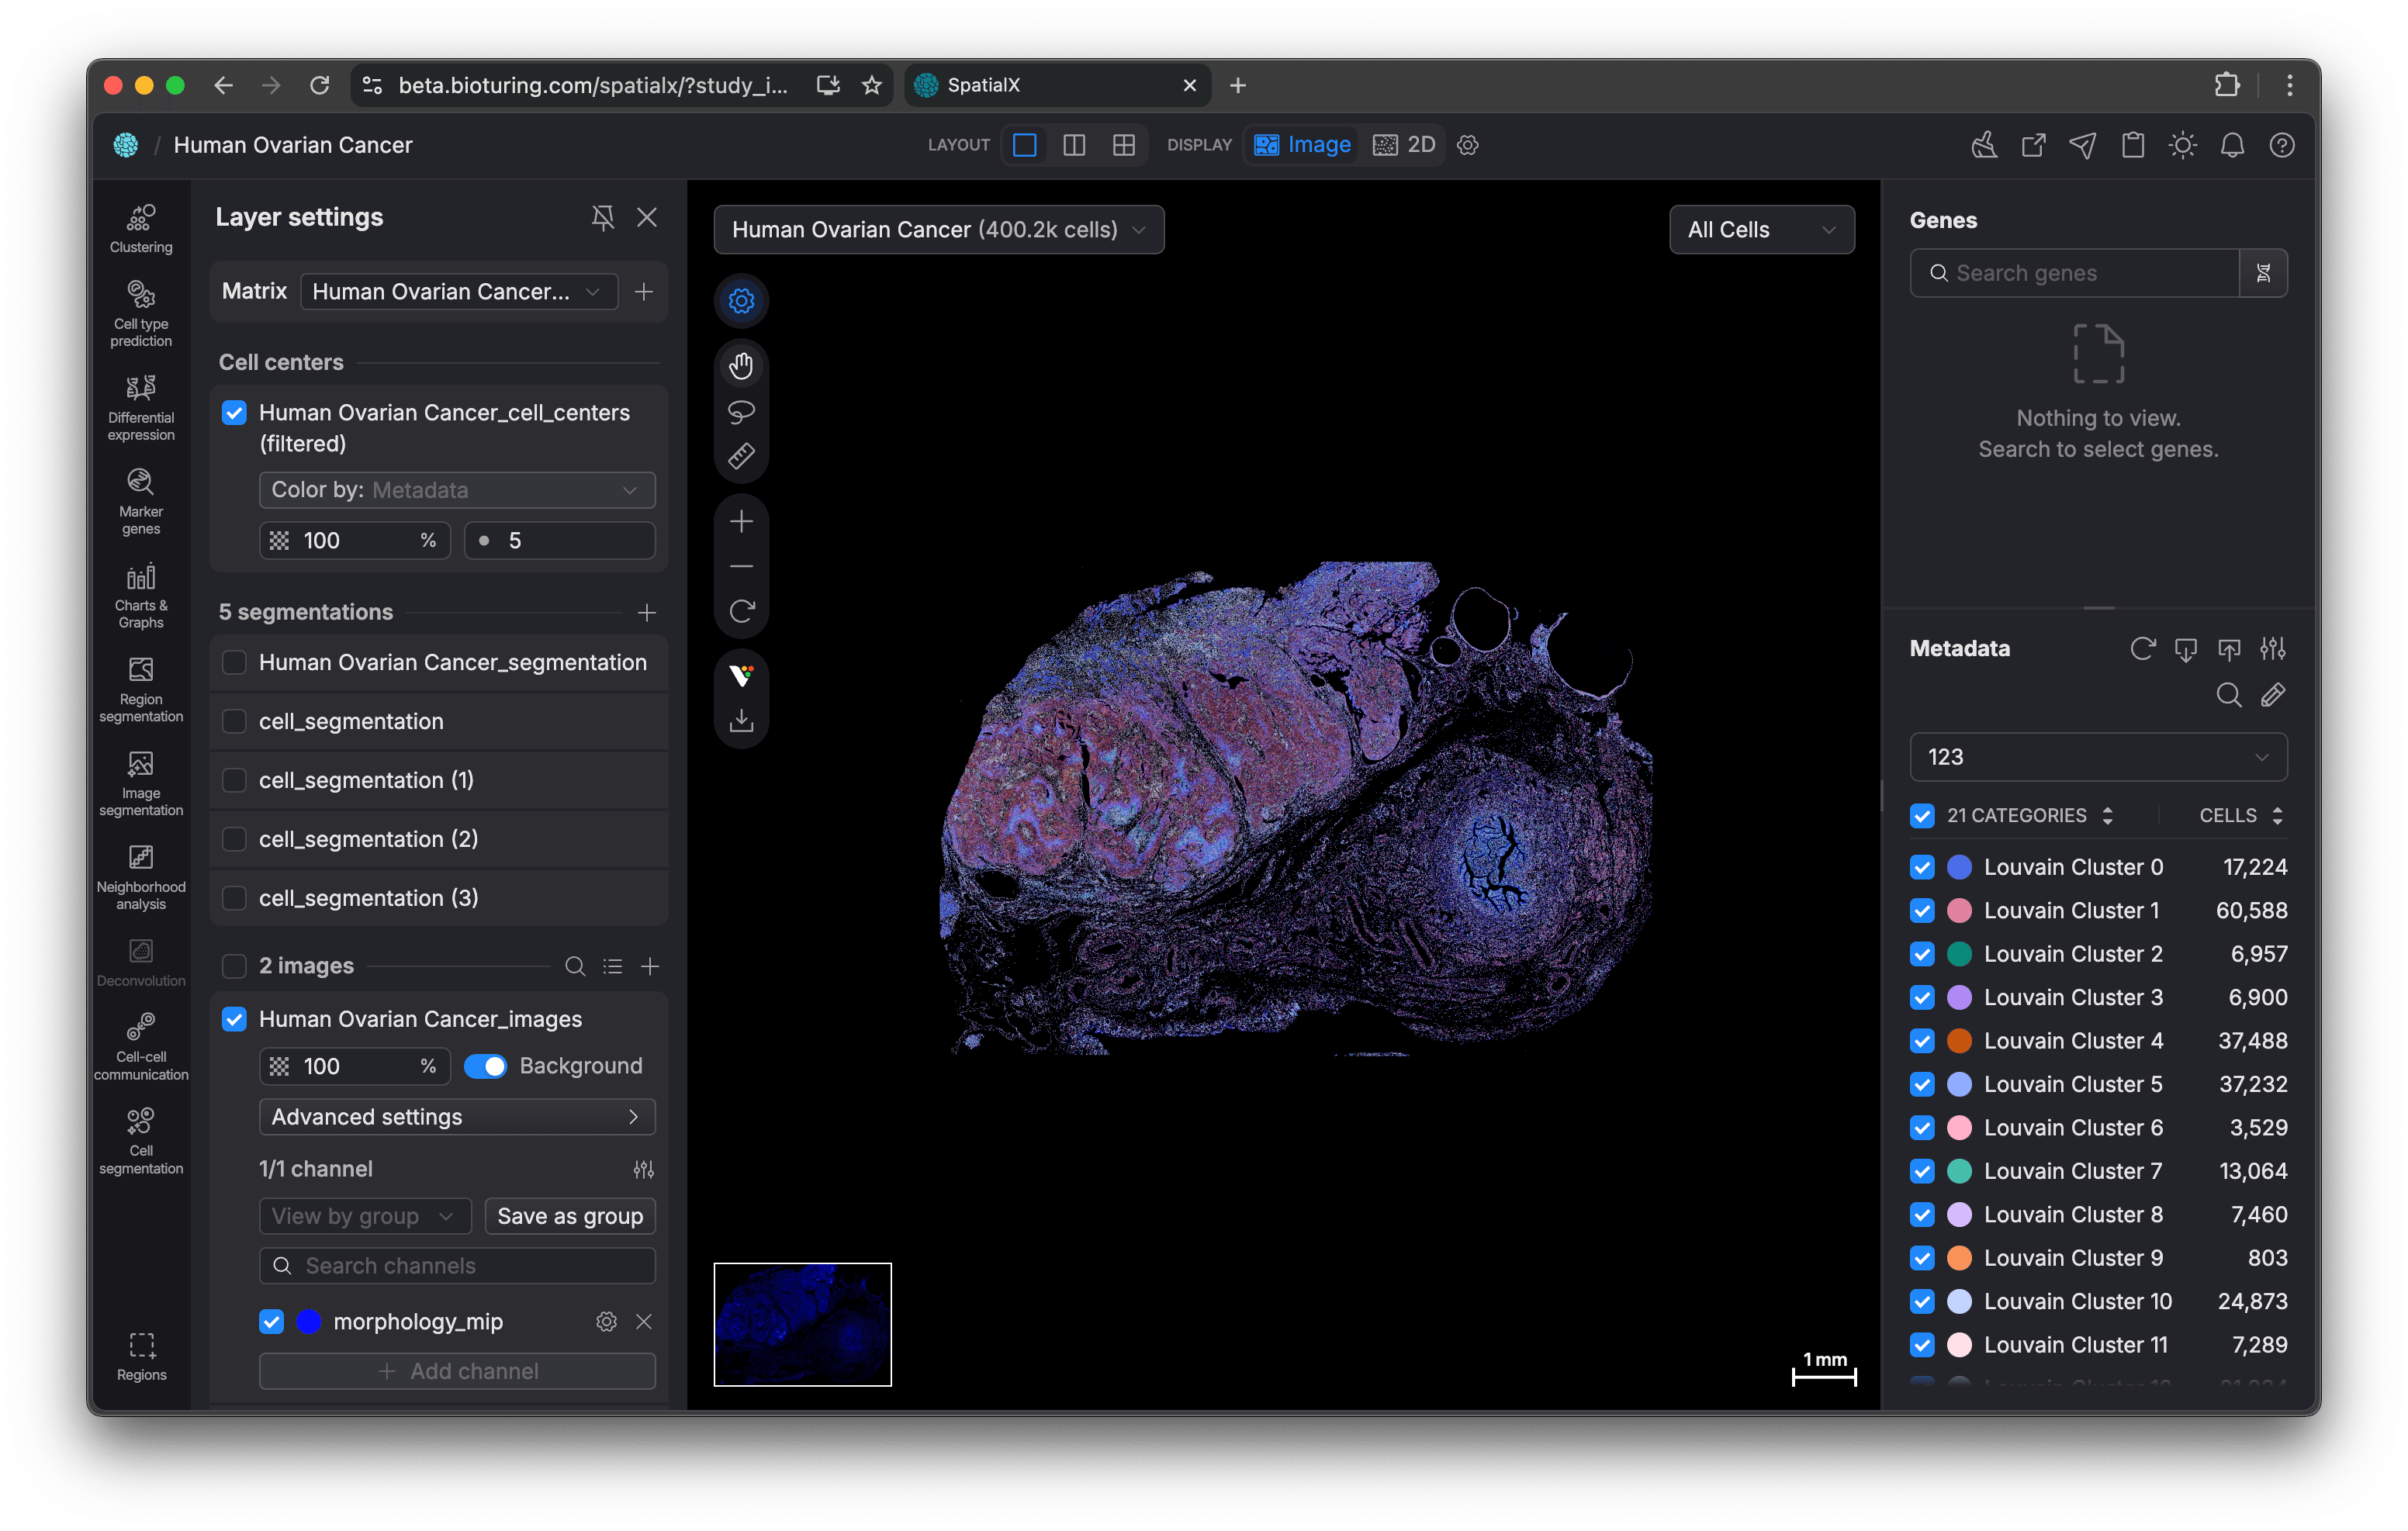
In less biology-heavy language: Spatial biology = adding a “Google Maps layer” to biology, showing not just what cells do but where they do it and how they interact. SpatialX is BioTuring’s product for exploring and analyzing tissue spatial data through an interactive, visual interface.
This page isn’t a full case study yet, it’s a work log while I’m still actively working on the product. I joined the project in its early days, so there have been many iterations, and we’re continuing to add features.
User
SpatialX serves professionals who work with tissue imaging and spatial omics data.
🔬
Biology scientists / researchers
- Run analyses and validate hypotheses on spatial datasets.
🎓
Biology students
- Learn spatial-biology concepts and explore datasets in an interactive way.
🩺
Pathologists (medical doctors who study the causes, processes, and effects of disease)
- Review tissue context and interpret spatial signals.
In practice, customer organizations can include research labs, universities, hospitals, and pharma / drug companies.
Application architecture
At a high level, the app is structured like this:
- There are multiple studies.
- Each study contains samples.
- Each sample contains data records.
- Each data record includes images and cell information. Each data panel can be viewed in Image view or Cell view.
The application itself is part of BioTuring ecosystem (we can link data between applications). There are some other products that focuses on different sides of bioinformatic research.
Application features (non-biologist explanation)
There are also several tools to analyze cells and images:
- Marker genes: identify genes that stand out in a selected region.
- Proteomics: view images by protein channels, with the ability to adjust thresholds.
and more. See the work log to track what I’m working on.
My role and process
My role sat between product design and front-end engineering, which let me move quickly from problem framing → UI decisions → implementation.
My typical process looked like this:
- Product specialist (biology background) gathers user requests / requirements
- Team brainstorm: they will explain the requirements to the team then we can help brainstorm how to form the features.
- Explore solutions in whatever medium fits the moment (Figma, Whimsical, whiteboard, or paper) — and sometimes skip this step for smaller features.
- Prototype directly in code, then iterate multiple times
- Demo to the team and users, collect feedback, then revise
- These two steps form a loop — I would go back and forth between prototyping and demo/feedback until the solution felt ready.
- Release a beta version, gather feedback, revise
- Release a final version
Occasionally, I also joined meetings with the product specialist to get feedback on the UX and UI, and then used that feedback to refine the experience.
Challenges
This has been one of the most complex products I’ve worked on. It was my first time working on a canvas-based application, and it required handling very large data responses and graphics-heavy implementation.
The biggest challenge was the biology and bioinformatics concepts—they were difficult to grasp at first. I had many discussions with product specialists (with biology backgrounds) to build understanding.
On the engineering side, I learned to use Deck.gl to create a Google Earth–like experience. Along the way, I also had to pick up a lot of math and new concepts through self-study.
Related posts
Work log
This block is password-protected
Please input the password below to view this block.
Password hint:
4 digits of my birthday + 3 last digits of my phone number.